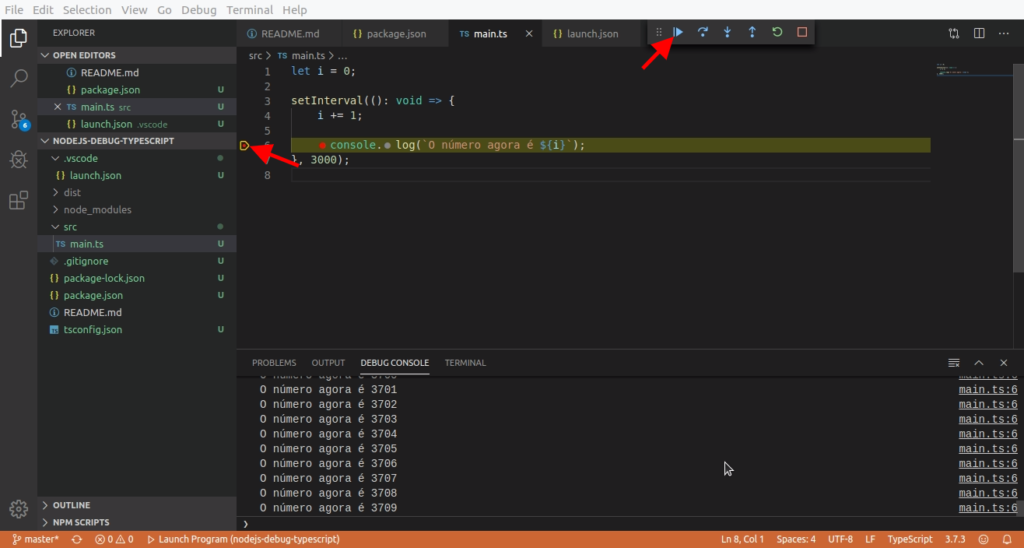
When we're in the development process, we spend a lot of our time "debugging" the code and trying to figure out why it doesn't work or worse, why it works… The debug step is very important and can be very time consuming, so if we optimize this bug hunting, we optimize delivery time as well as quality.

Visual Studio Code supports the TypeScript debugger through its native JavaScript debugger.
In this tutorial we will learn how to debug typescript running directly on the machine, click here if you are looking for how to debug typescript with docker.
The debugger doesn't work automatically, so we need some settings to make it work.
JavaScript source map support
To get debug in TypeScript we need to enable source maps at compile time, this setting tells the compiler to generate a map file, which allows reverse engineering for the debugger to identify the exact line of code in TypeScript.
creating the file tsconfig.json
If your project doesn't have the file yet tsconfig.json , let's create a file with the minimum settings for this tutorial:
{
    "compilerOptions": {
      "target": "ES2020",
      "rootDir": "./src",
      "outDir": "./dist",
      "sourceMap": true,
    }
  }
A brief explanation of what these options mean, for more options see the official documentation :
- target: What version of ECMAScript do we want to compile
- rootDir: What is the folder of our TypeScript files
- outDir: What is the destination folder for compiled JavaScript files
- sourceMap: Enable the creation of file map files to use the debugger
creating the file launch.json VSCode debug
The launch.json file contains all the debugger settings for the project, creates a folder called .vscode and inside it a launch.json file with the following content:
{
  "version": "0.2.0",
  "configurations": [
    {
      "type": "node",
      "request": "launch",
      "name": "Launch Program",
      "preLaunchTask": "tsc: build - tsconfig.json",
      "program": "${workspaceFolder}/src/main.ts",
      "outFiles":["${workspaceFolder}/dist/**/*.js"]
    }
  ]
}
Testing our new setup

Now that we've configured all the necessary configuration, we can start debugging our application. Click on the ▶️ button on the debug tab or via the shortcut F5 . If everything is correct, the compilation process will take place and the debugger will pause on the selected line.
4
votos
